Reports & Analytics
The charts Invy gives you out of the box, and how to export your data.
Open Reports & Analytics from the sidebar to see how your inventory is trending, without building anything yourself.
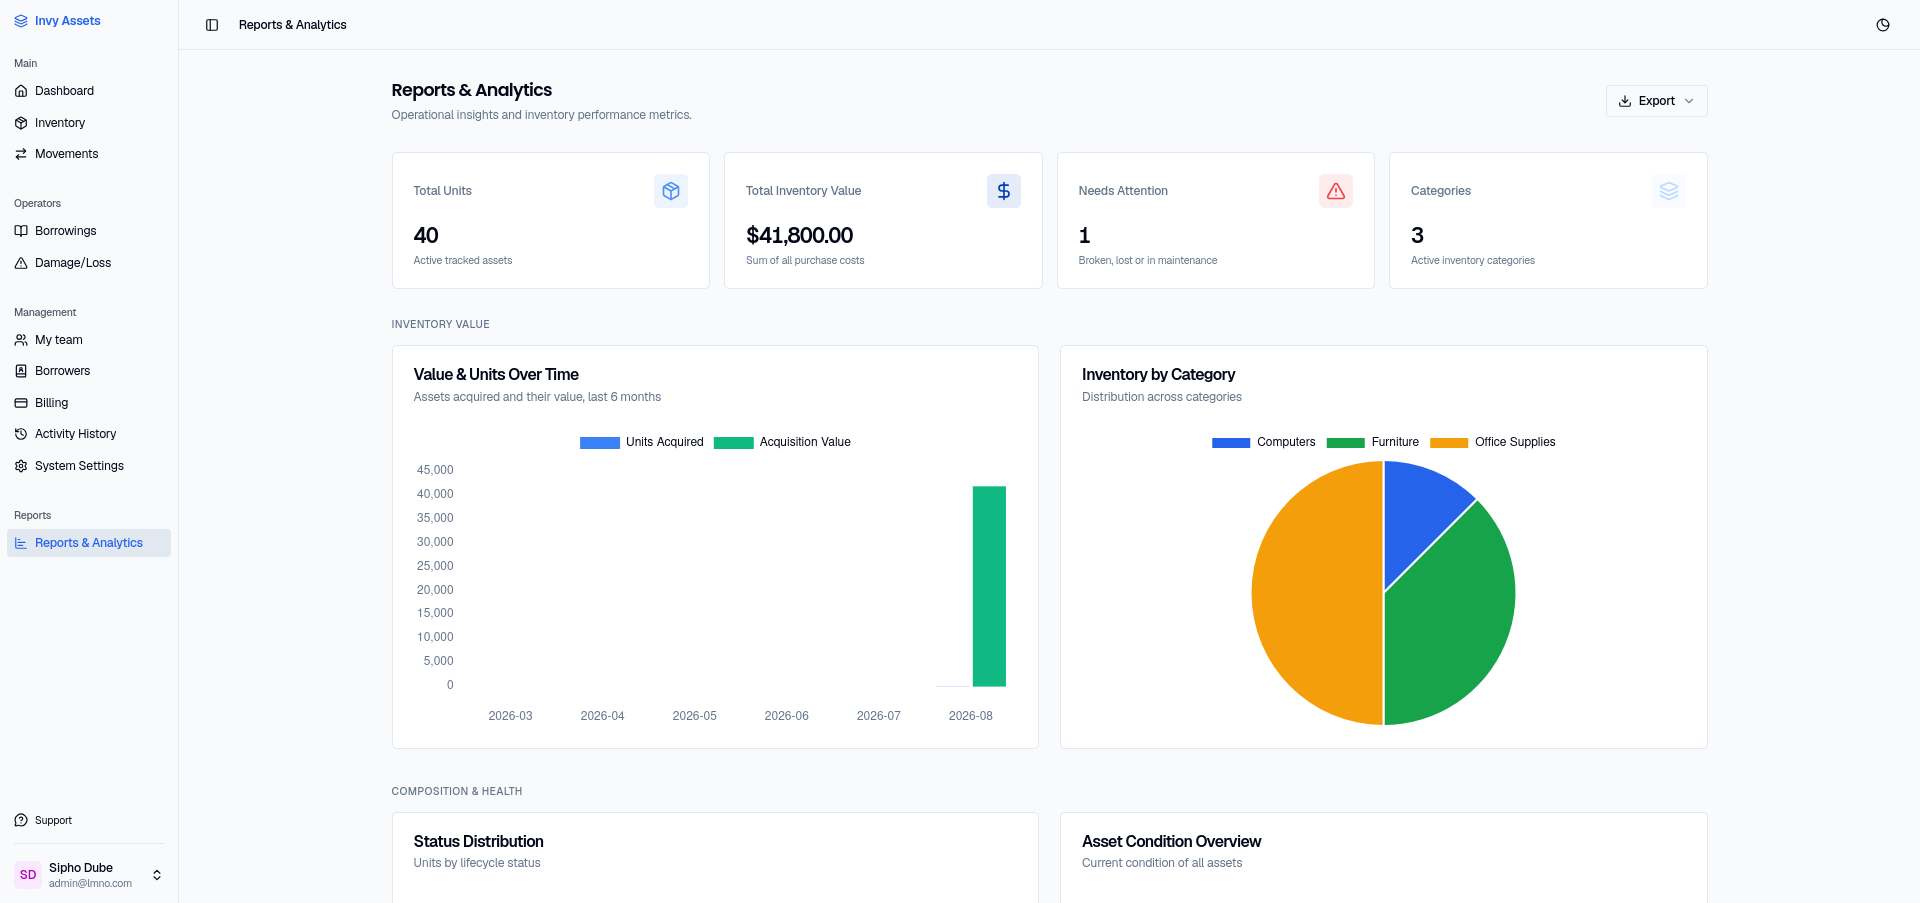
What’s on the page
- Value & Units Over Time — inventory value and unit count over the last six months
- Inventory by Category — a breakdown of what you hold, by category
- Status Distribution — how many units are in stock, checked out, or in maintenance
- Asset Condition Overview — the split across condition ratings
- Assets by Location — where your value is concentrated, by folder
- Asset Aging — how long units have been held, bucketed by acquisition age
- Most Borrowed — your most-utilized items, ranked by loan count
- Recent Activity — a live feed of the latest changes across your organization
Every figure on this page covers company-owned units only. Personal items — things on your premises that belong to individuals — are excluded, and a note under the stat cards says how many were left out.
Exporting data
Click Export at the top of the page for:
- Analytics Summary (PDF) — a formatted summary of the charts above
- Full Inventory Audit (PDF) — a complete printable record of your inventory
- Complete Data Export (CSV) — raw data for use in spreadsheets or other tools, including Ownership and Owner columns
- Personal Property Register (PDF or CSV) — every personal item, grouped by owner
The Full Inventory Audit lists personal items in their own section, Personally Owned Items (Not Company Property), and leaves them out of every total.
There’s no scheduled/recurring report delivery today — exports are generated on demand, whenever you need them.
Next steps
- Review the org-wide audit trail for a full history of changes.
- Control who can see reporting data by role.
- Report and resolve damage to keep your condition data accurate.